Philadelphia Housing Price Prediction

A Briefing from COCO Consultancy

Zhuosi Yang, Veronica Zheng, Yiting Zhong, Coco Zhou

2026-03-17

What shapes housing values in Philadelphia?

  • Housing prices vary substantially across Philadelphia.
  • Property characteristics explain part of that variation, but not all of it.
  • Broader neighborhood conditions may also shape market outcomes.
  • Reliable home price prediction helps government better understand local housing markets and informs housing policy design.
  • Our goal is to build and evaluate a housing price prediction model that improves predictive accuracy across Philadelphia.

Data Sources

  • Property sales and structural housing characteristics
    Source: Philadelphia Property Sales
    18,485 residential property sales from 2023 to 2024
    Structural housing characteristics data includes home size, year built, bedrooms, bathrooms, interior and exterior condition, and other housing features

  • Neighborhood socioeconomic characteristics
    Source: U.S. Census Bureau ACS
    Data include median household income and households without a vehicle

  • Neighborhood amenities and accessibility
    Source: OpenDataPhilly
    Data include schools, major parks, transit stops, crime incidents, and vacant properties

Distribution of Home Sale Prices

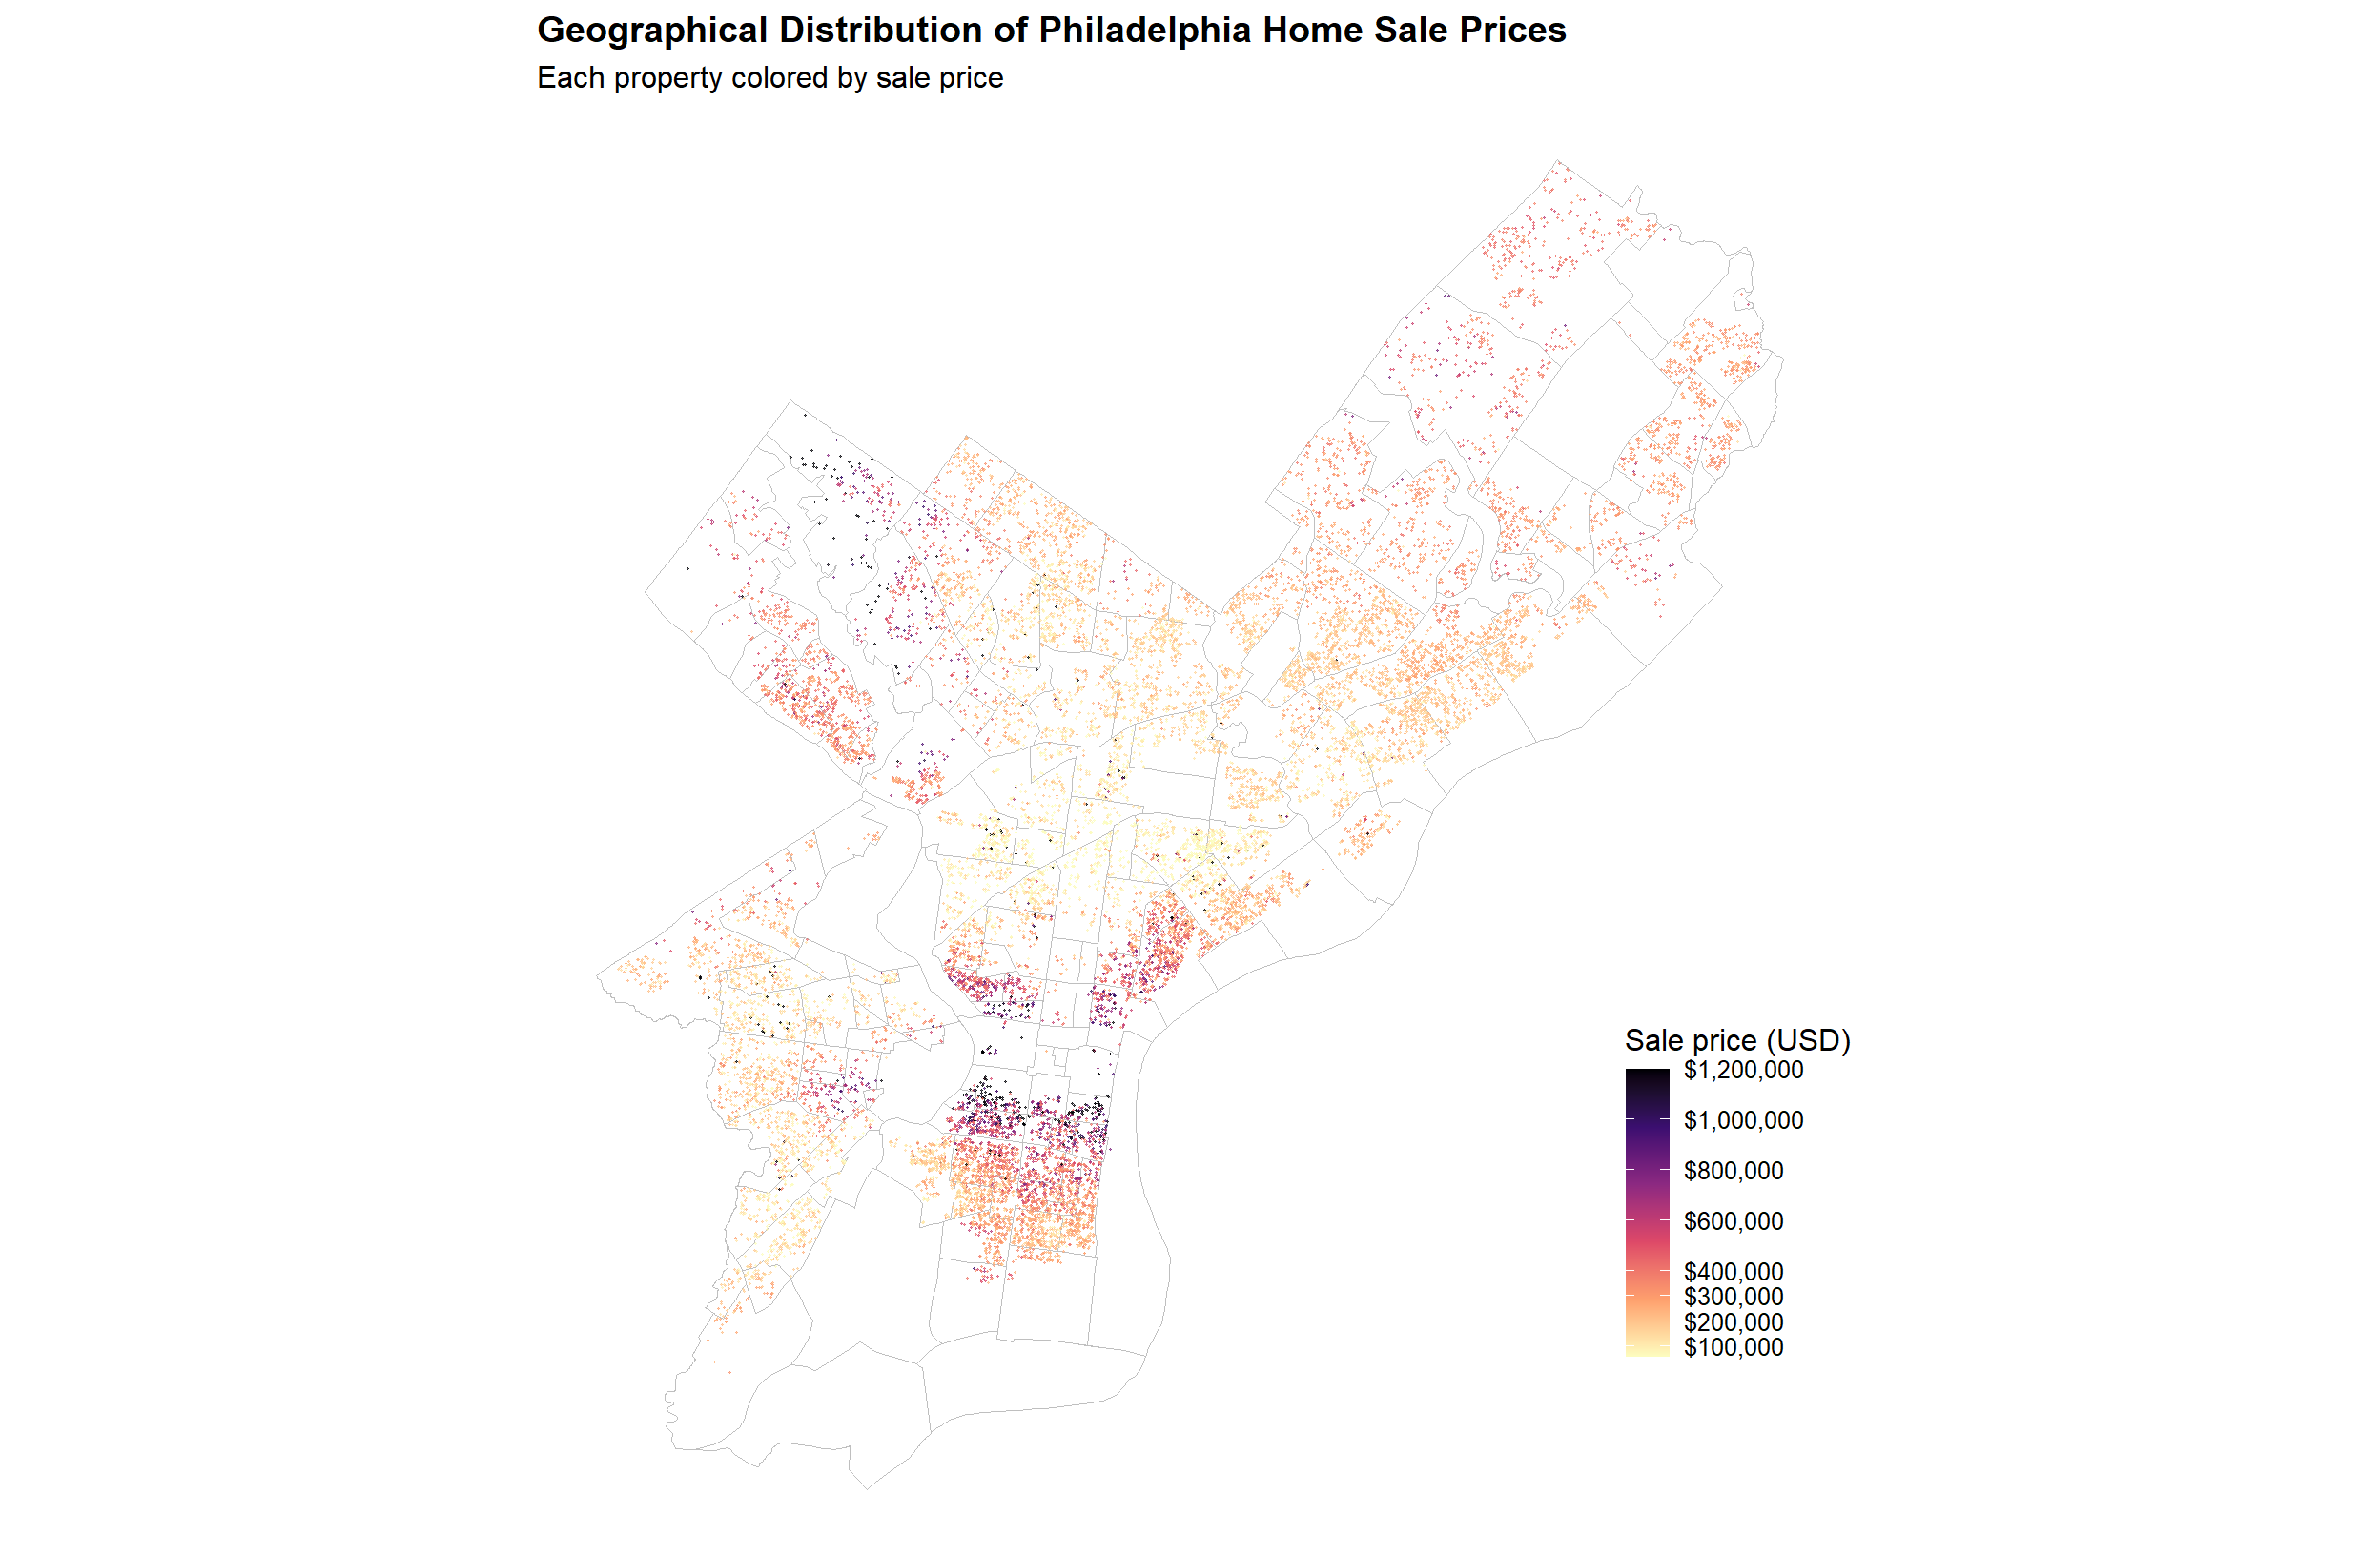
Higher-priced homes cluster in Center City and nearby neighborhoods, with another smaller cluster in Northwest Philadelphia. This pattern suggests that location and neighborhood context are major drivers of sale prices.

What drives home prices most clearly?

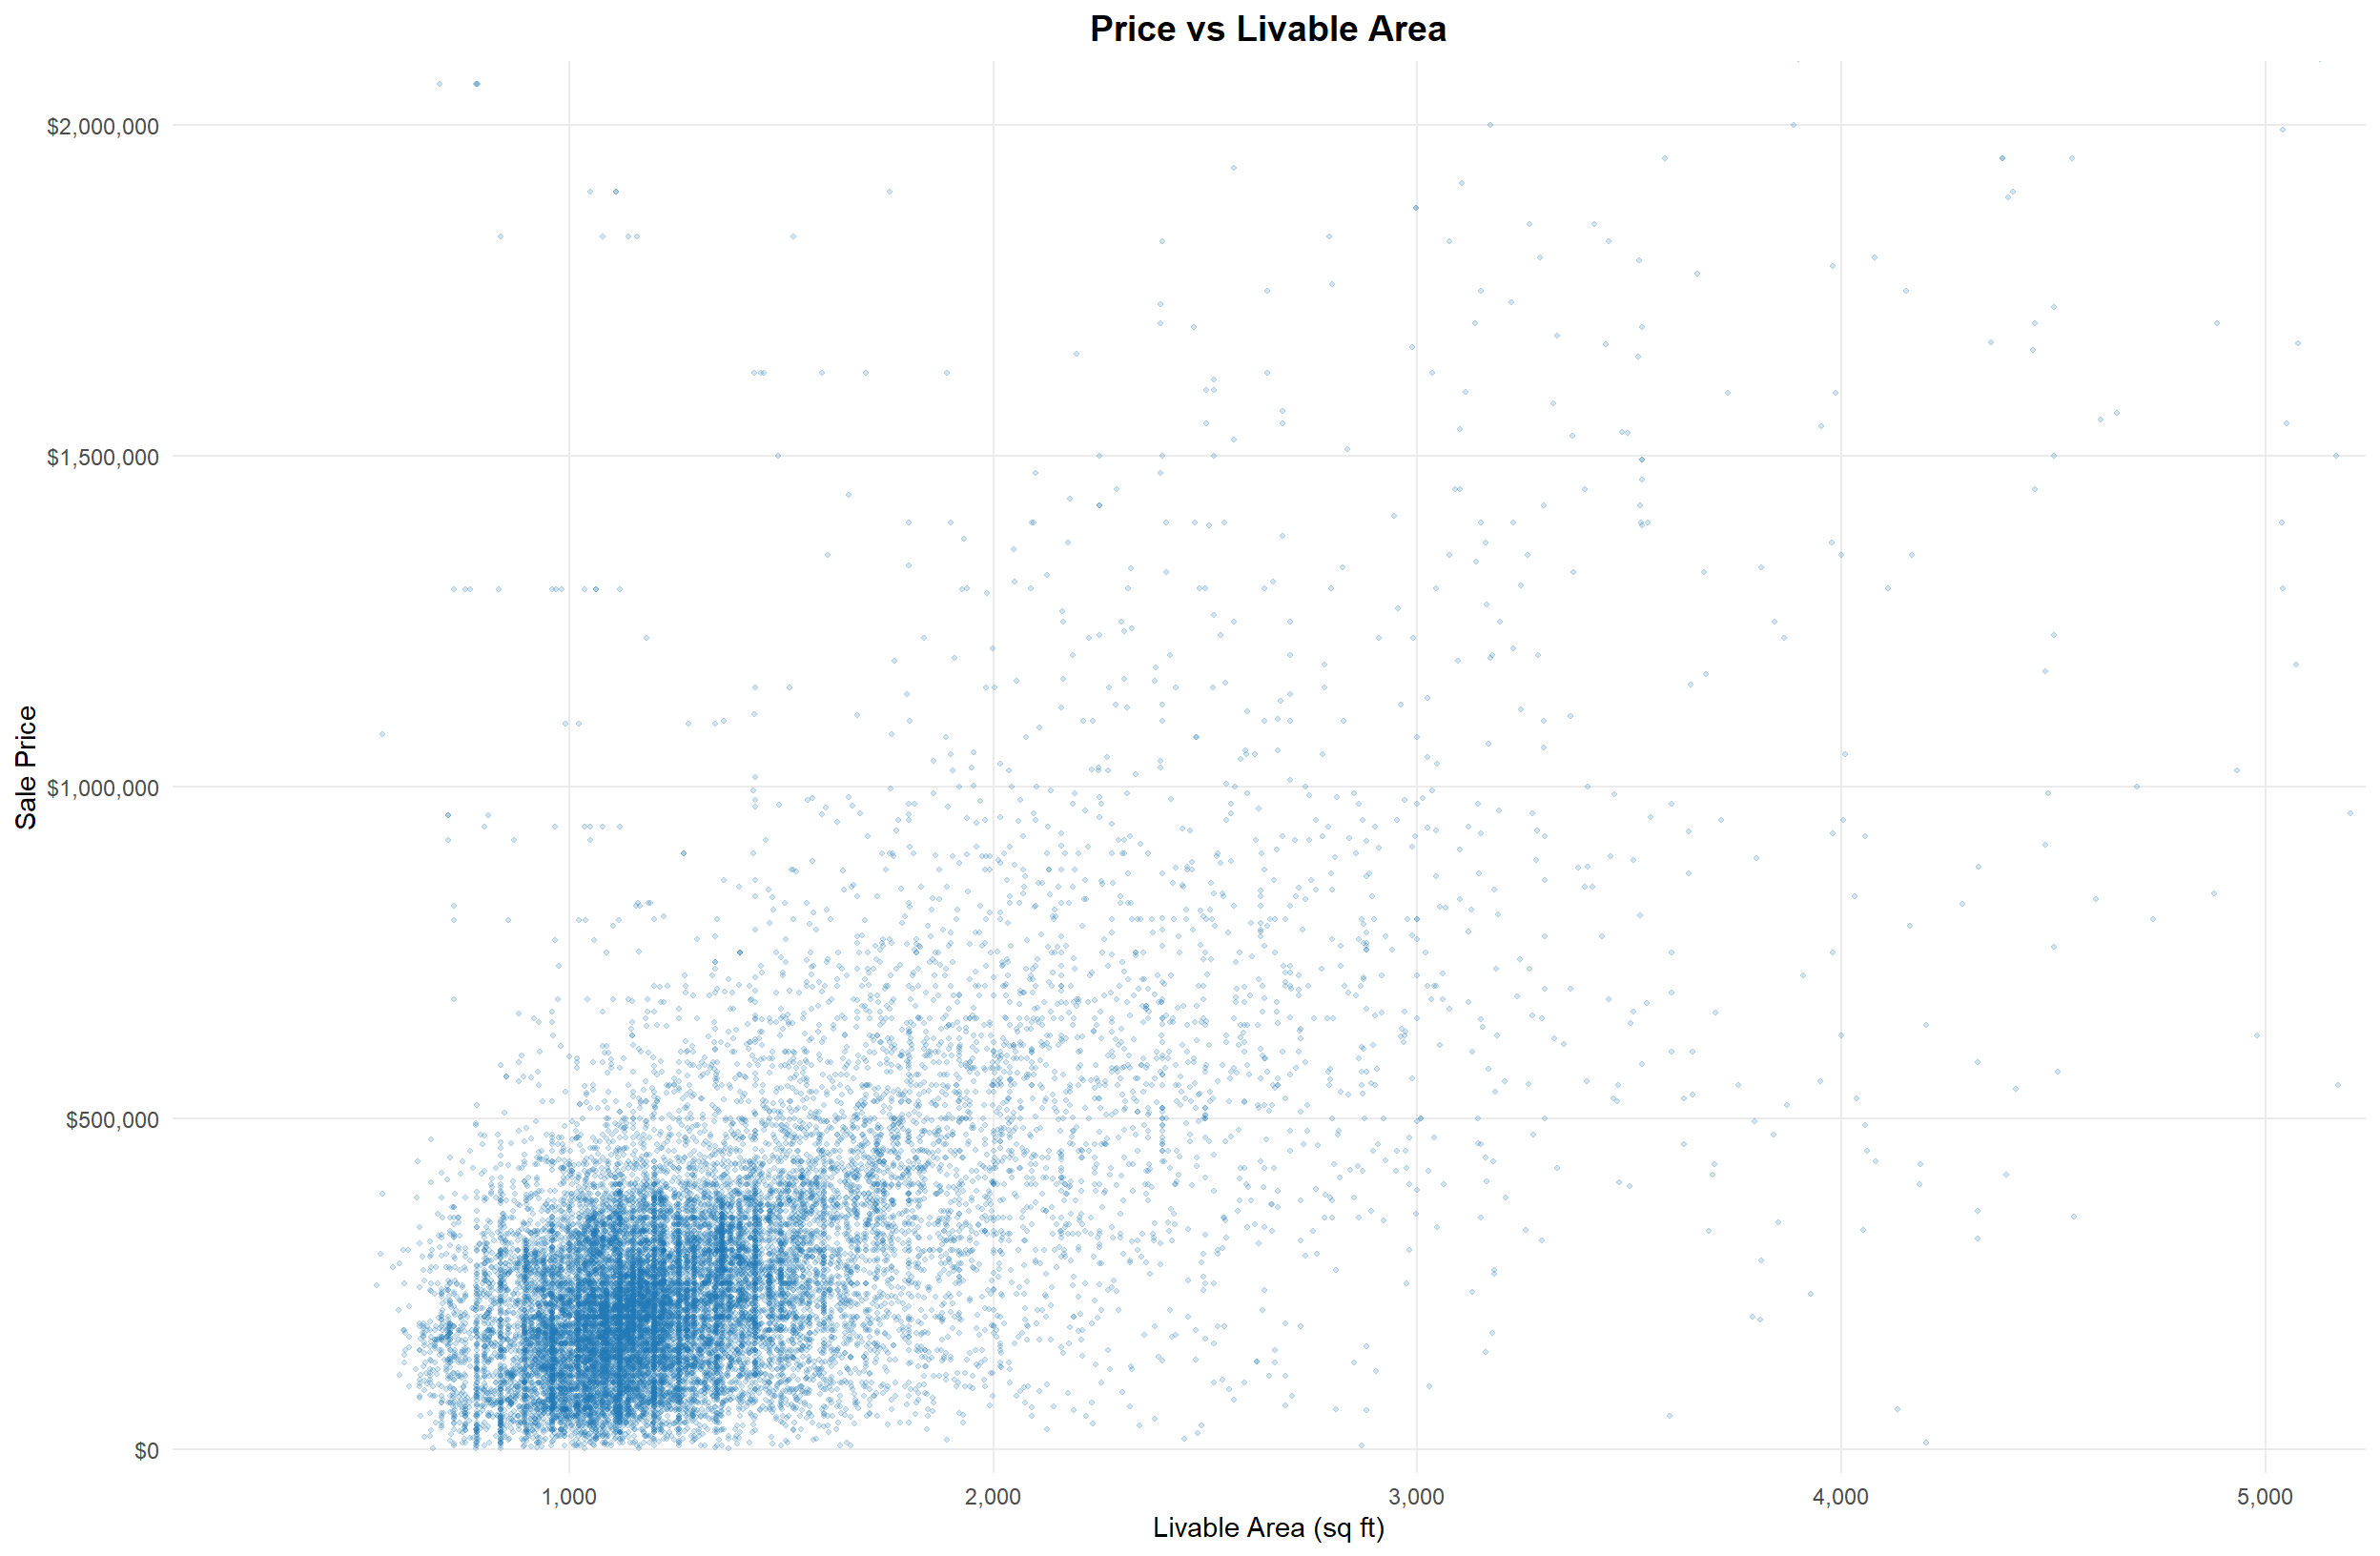
Sale prices generally increase with livable area, making housing size one of the strongest structural predictors of price. However, the wide spread in prices for similarly sized homes suggests that neighborhood context also matters.

How did the model evolve?

  • Model 1: Structural
    Housing characteristics only, including livable area, bedrooms, bathrooms, garage spaces, fireplaces, interior condition, and housing age

  • Model 2: + Spatial and socioeconomic context
    Added crime, distance to school, distance to park, distance to SEPTA, nearby vacancy, median income, and households without a vehicle

  • Model 3: + Non-linear location effect
    Added distance to Center City and its squared term

  • Model 4: + Interaction
    Added an interaction between SEPTA distance and the share of households without a vehicle

  • Model 5: + Census tract fixed effects
    Added tract fixed effects to capture unobserved neighborhood differences

Model Comparison


Model R² (CV) RMSE (CV) MAE (CV)
Structural 0.555 135,959 92,434
Spatial + Socioeconomic 0.687 114,037 70,907
Non-linear term 0.702 111,347 68,884
Interaction 0.702 111,302 68,918
Fixed Effect 0.771 97,499 57,279


The final model performs best with an R² of 0.771, which means that this model explains about 77% of the variation in home prices. The predicted price is usually about $97,500 away from the actual sale price, which is about a 28% improvement over the baseline structural model.

What matters most in the final model?

  • Neighborhood context matters most overall
    The model improves the most when we add spatial and socioeconomic factors such as income, crime, transit access, parks, and vacancy.


  • Allowing each neighborhood to have its own baseline price improves the model further
    This shows that homes with similar features can still sell for very different prices depending on the neighborhood.


  • Livable area is the strongest structural predictor
    An additional 1,000 sq ft is associated with about $136,000 higher sale price, holding other factors constant.

Where is hardest to predict accurately?

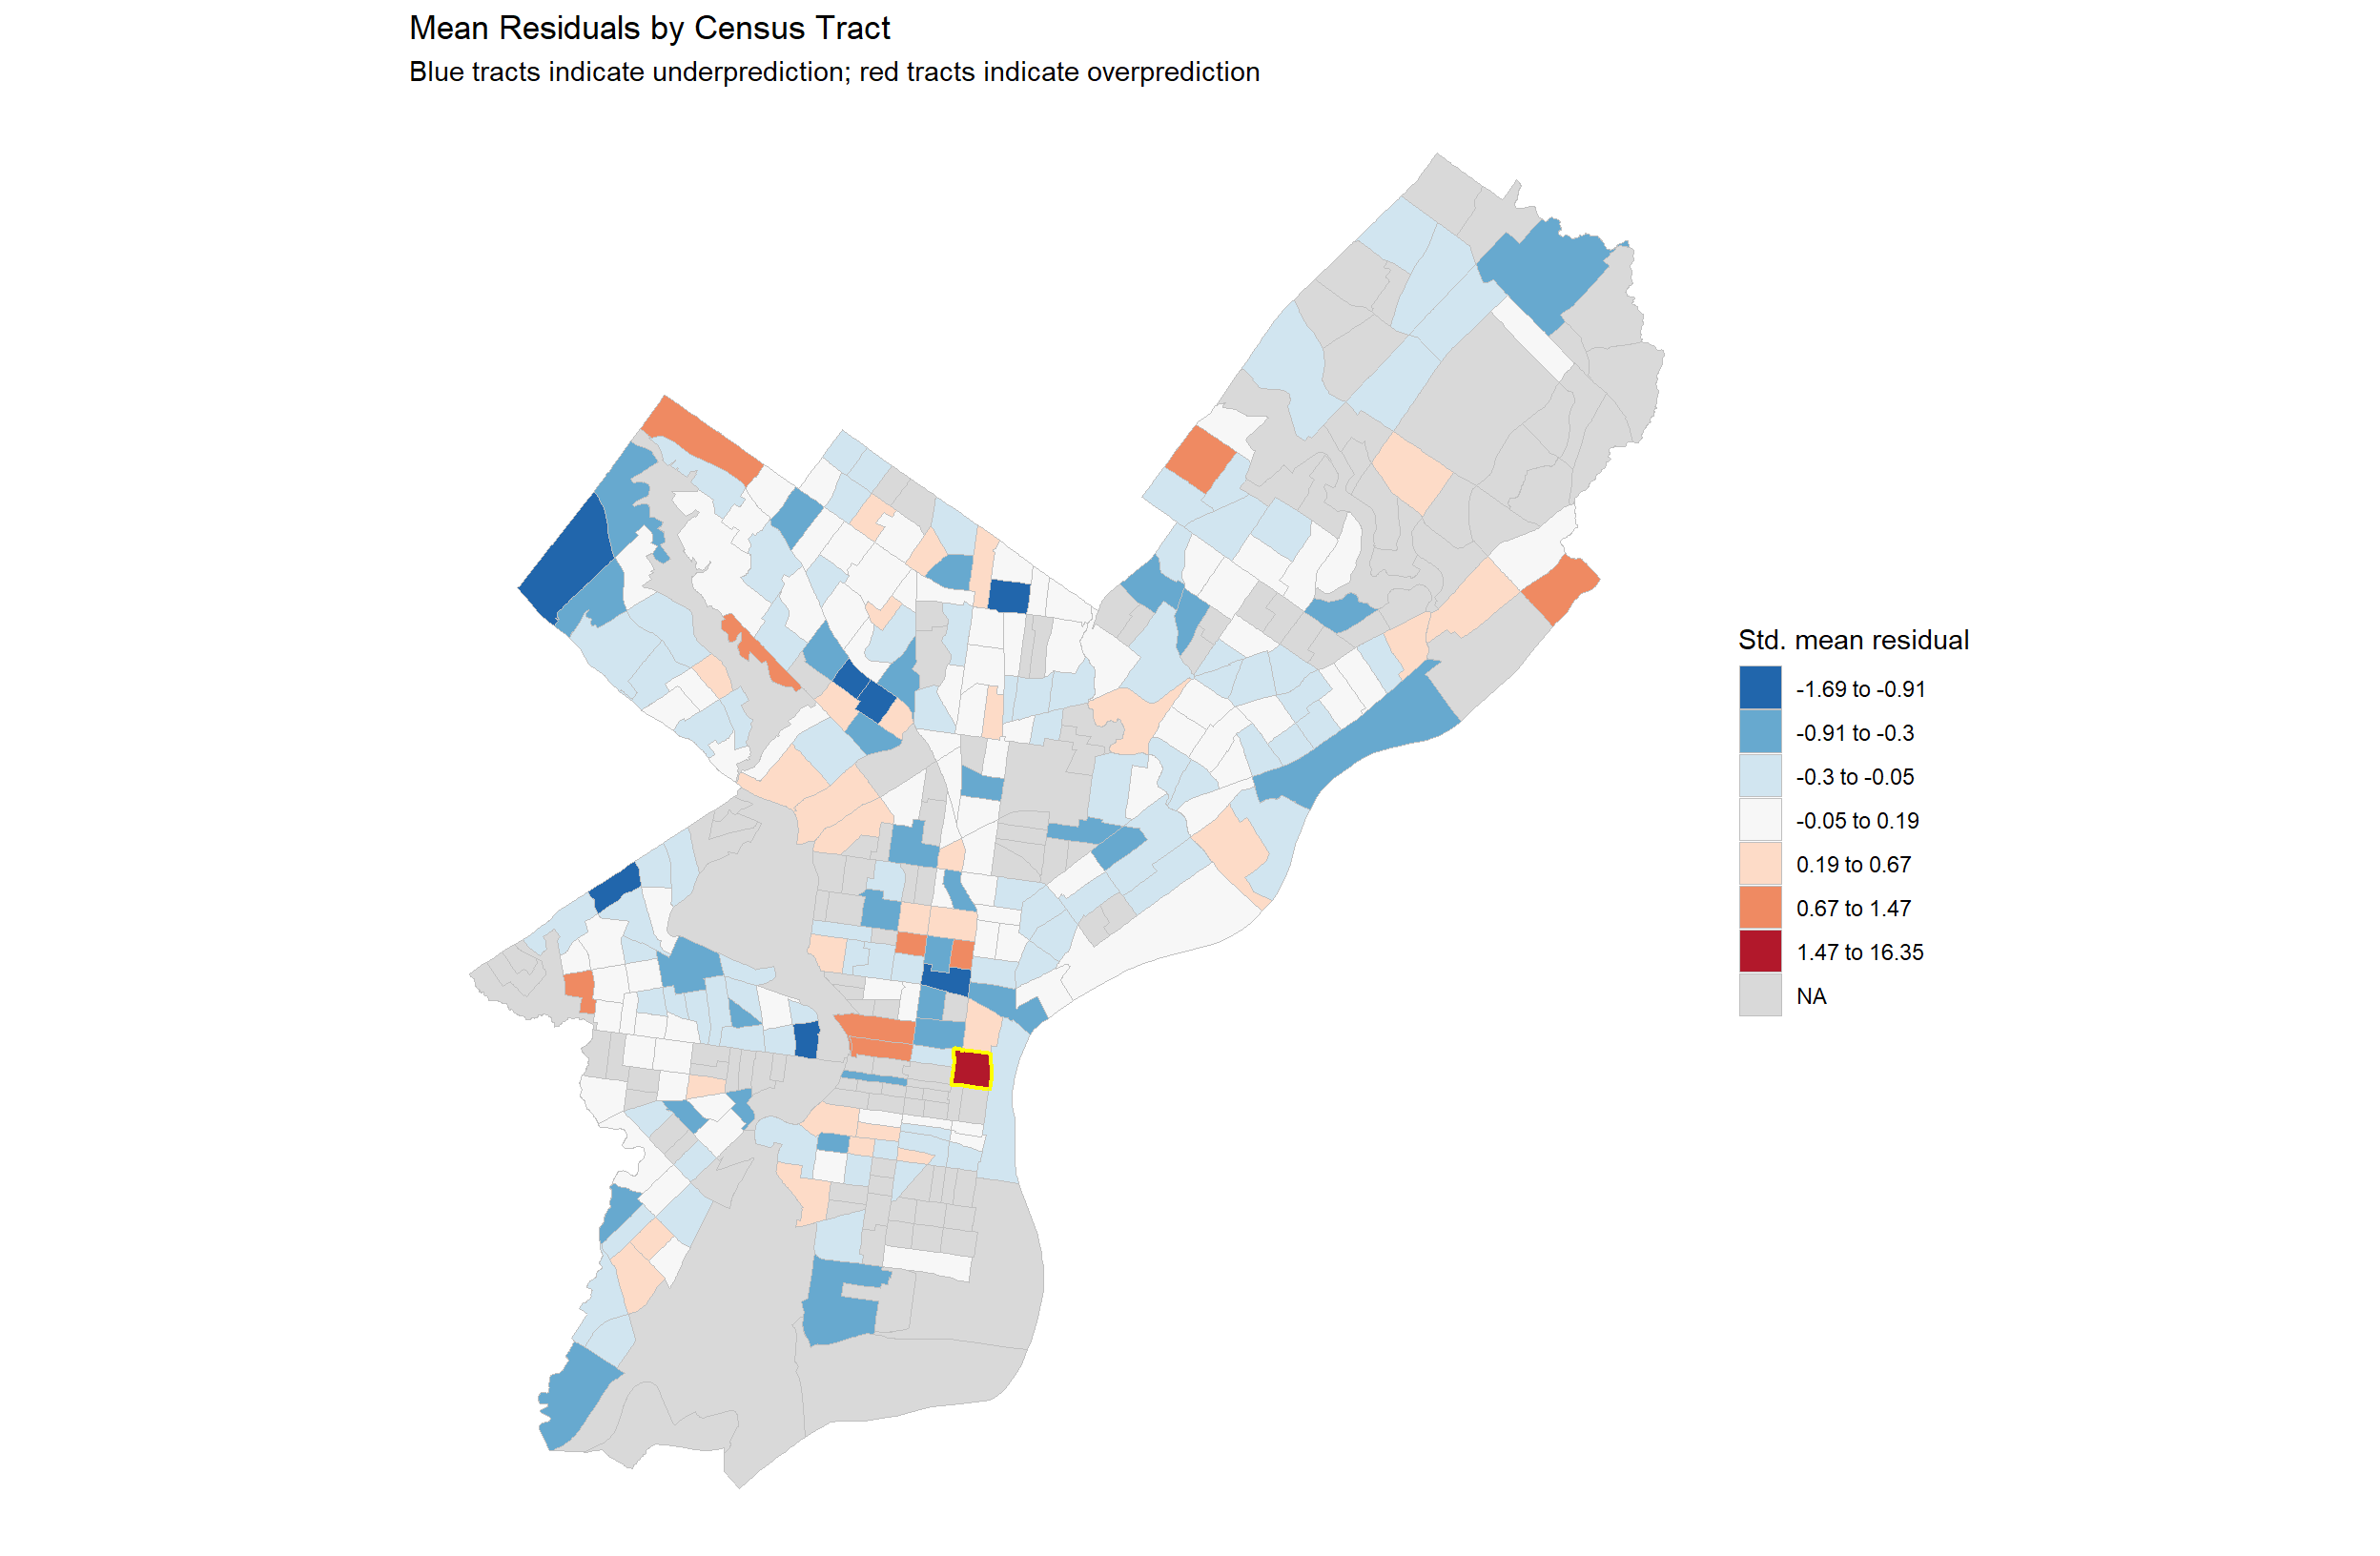
Residual is calculated as actual sale price minus predicted sale price.
Census Tract 1, highlighted in yellow, has the largest residual, which means it is the hardest neighborhood for the model to predict accurately and that prices there are often underpredicted.
It is located in Old City, which may reflect unique neighborhood characteristics, historic housing stock, or localized market dynamics that are not fully captured by the included variables.

Recommendations

  • Use the model as a decision-support tool
    This model can help inform policy by identifying neighborhoods with unusual market patterns and tracking where local market conditions may be changing. Any major policy or assessment decision should still be supported by follow-up analysis.


  • Design housing policy at the neighborhood level Because housing markets vary widely across Philadelphia, policy responses should be tailored to local conditions rather than applied uniformly across the city.


  • Target additional review where prediction errors are highest
    Areas with consistently large errors should receive closer attention to reduce the risk of systematic under- or overvaluation.

Limitations & Next Steps

  • The model predicts market value, not intrinsic or socially fair value
    Because it is estimated from observed sale prices, the model reflects how the market values housing rather than what they may be worth in a broader social or policy sense.

  • Some important local factors are still missing
    The model does not fully capture things such as renovation quality, historic character, school reputation.

  • The model is not equally accurate everywhere
    Some neighborhoods remain harder to predict and need closer local review.

  • Next step
    Add more detailed neighborhood-level factors and update the model annually update the model regularly with the latest property value data.

Thank you for your attention and welcome your questions!

  • COCO Consultancy
  • March 17, 2026